Updated exoplanet plots for Chapter 9
| By The Cosmos
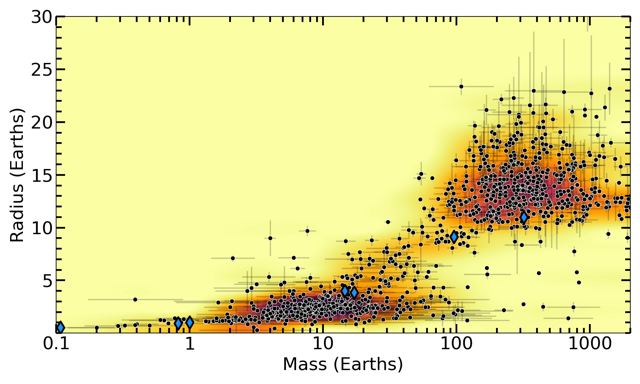
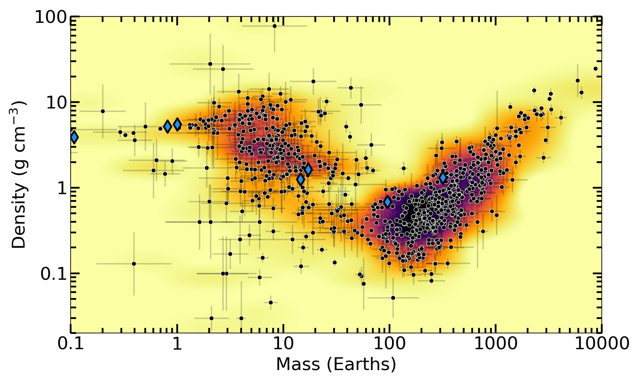
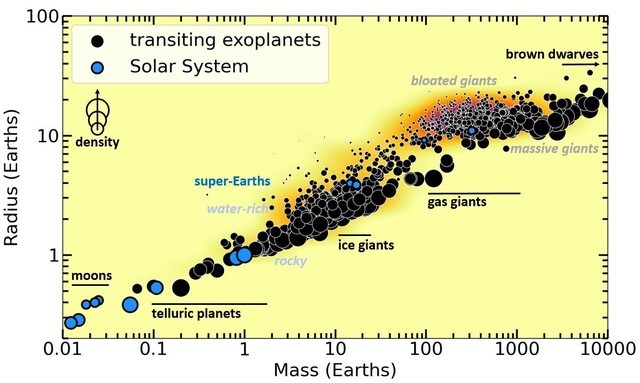
Updated plots for Chapter 9, including Figures 9-8 and 9-9, courtesy of David Ehrenreich (University of Geneva).
Black points represent exoplanets and blue points Solar System objects. Error bars are shown in the first two plots. The color map behind the points represents the parameter space density (the darker it is, the more planets in that region).
Share this with
Facebook
Twitter
Email