Running a Debugger in a Spyder Notebook
This page discusses using a debugger in a Spyder notebook, as mentioned in Section 11.2 of the textbook.
Setting Breakpoints
In the Spyder IDE, breakpoints are set by clicking on the line in the source code (in the Editor pane) where we want the breakpoint, then selecting the menu command “Debug → Set/Clear breakpoint”. A small red stop-sign appears in front of that line in the Editor pane, indicating a breakpoint is set there. We can set multiple breakpoints in one source code file. As we execute the program from breakpoint to breakpoint, we can observe what variables are defined and what their values are via the Variable Explorer pane. This pane is enabled by selecting the menu command “View → Panes → Variable explorer”.
Stepping Through the Code Using the Debugger
We control execution via the following block of buttons:

that control Spyder’s debugger, the tool that enables us to run the program slowly, to help us find the bugs in our program. By executing the program using the debugger (rather than the normal Python interpreter), we can run the program from breakpoint to breakpoint as well as one line at a time. The leftmost button starts running the program using the debugger, from the beginning of the code file. Execution continues until a breakpoint is reached or the program ends. The fifth button from the left continues execution until the next breakpoint. The other buttons provide other ways of stepping through the program and are also available as options or sub-options in the Debug menu.
Below shows Spyder in a run with the code file kinetic_energy.py in the Editor pane (with 2 breakpoints set in it), the Variable Explorer pane open, and the Console open:
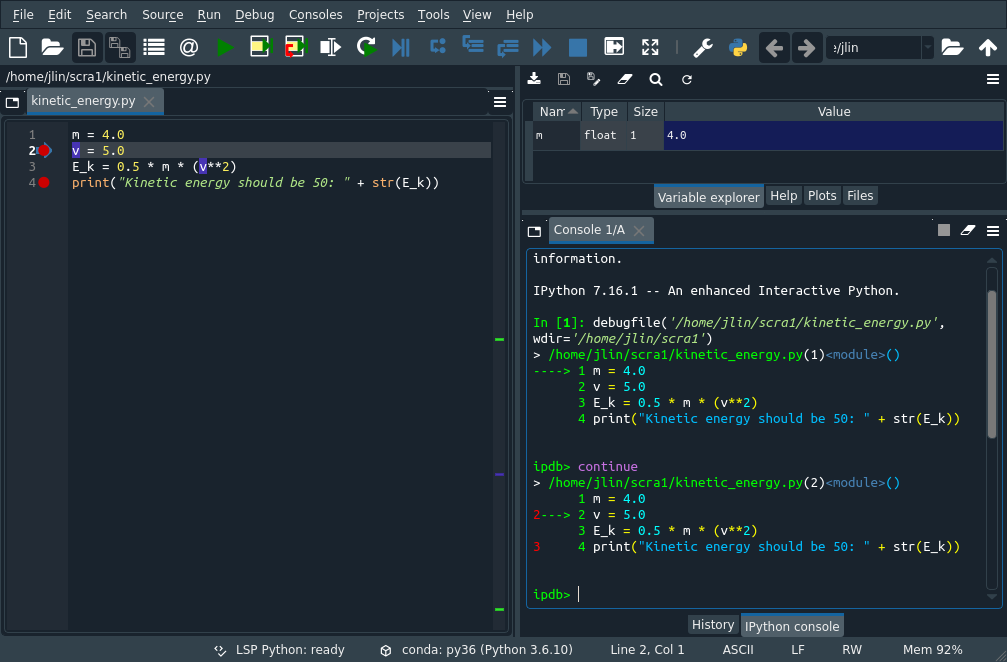
Breakpoints are not stored in the code file. They are only set and appear in the Spyder IDE. If we open up the file again in the Spyder IDE, the breakpoints will be there, but if we open the file in a text editor, the breakpoints will not be there.
The above figure shows the state of the debugger after running the code from the beginning until the first breakpoint. When the debugger reaches the breakpoint, execution stops and the line the breakpoint is defined at is not executed. As the Variable Explorer pane in the figure shows, at this point, the only variable that exists is m and it has the value 4.0. To continue executing until the next breakpoint, we can select the menu command “Debug → Continue” or the corresponding button on the debugger button palette. If we do so, the Variable Explorer pane will show 3 variables—E_k, m, and v—which are the variables defined after line 3 in the file is executed. The judicious use of breakpoints (and other debugger tools) enables us to see exactly what is the state of all the variables at key points in our program, so we can see whether our program is correctly calculating the in-between or intermediate values.